Volatility Index (VIX/VXO)
Implied volatility on options (VIX) is often used as a contrary indicator. If markets sell off and fear is high, the volatility index shoots up and may indicate a market turning point. Market tops are characterized by low volatility.
 .
.
.
Investing/Trading Strategies
Description
Technical Analysis Based
Profitable stock trades can be made based on historical stock price information:
- Support and resistance levels
- Moving averages
- Chart patterns
- Momentum metrics
- Standard deviations
- Trading volume
- and so on
Fundamental Analysis Based
Profitable stock investments can be made using valuation metrics:
- Stock Price to Earnings
- Stock Price to Sales
- Book Value
- Debt to Equity
- and so on ...
Investor Psychology Based
Trading based on investor psychology:
- Usually a contrarian approach
- Emotions are more important than fundamentals or even technicals
- Ex: CNN Fear & Greed Index
Seasonality Based
Stocks and commodity prices are influenced by seasonal factors:
- Demand for gold during festival or wedding season
- Sell in May and Go-away for US Stock markets
- Window dressing by mutual funds
Efficient Market Hypothesis
Markets are efficient:
- All the information is instantly disseminated
- Past has no affect on future
- Stock prices are random
Stock TA
Symbol:
Analysis Chart RTQ Fibs News Opinion Profile
Analysis Chart RTQ Fibs News Opinion Profile
Presidential Year Seasonality
-
Mid-term Year (e.g., 2010)
- Q1: -0.1%
- Q2: -0.2%
- Q3: +3.0%
- Q4: +8.0%
-
Pre-election Year (e.g., 2011)
- Q1: +5.5%
- Q2: +5.0%
- Q3: +2.4%
- Q4: +2.6%
-
Election Year (e.g., 2012)
- Q1: +1.8%
- Q2: +1.6%
- Q3: +1.8%
- Q4: +2.0%
-
Post-election Year (e.g., 2013)
- Q1: -1.0%
- Q2: +1.0%
- Q3: +2.2%
- Q4: +2.0%
See Source
Sentiment Surveys
- Investment Advisors Survey by Investors Intelligence
- AAII individual investor survey
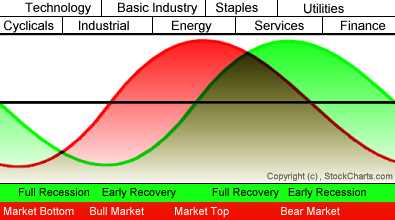
Economic Cycle Based
Buy & Hold
- Over long term stocks always go up.
- Indexes beat active investing (John Bogles approach)
Dollar Cost Averaging (DCA)
Buy at regular intervals (diversification over time). See calculation of returns with DCA.
Japanese Stock Market Performance
Over 25 Years
Over 25 Years
Insider Buying & Selling
Other Cycles Based
US Stock Performance Over 12 Years
S&P500 returned almost 0% over 12 years from 1999 - 2011.
Share Buy Backs
Contrary to common sense, companies seem to step up share repurchase programs when prices are high!

Other
- Sustainable growth & economic moats (Warren Buffets approach)
- Thematic investing based on mega trends
Google Ads
---- Advertisement ---- <!--
google_ad_client = "ca-pub-6606060213303530";
/* MB_LeftAd_v3 */
google_ad_slot = "9229582339";
google_ad_width = 160;
google_ad_height = 600;
//-->
Resources
- Market Model from VectorGrader combines valuation, momentum, interest rates, etc.
- Market Rotation Model
Monthly Seasonality
Description