US Stock Market Capitalization vs GDP
Shiller P/E of S&P500
Regular P/E of S&P500
Resources
- Online stock valuation model
- Another stock valuation model
- Vector Grader: US, India, & Japan Market Valuation Charts
- Higher Tobins Q-Ratio indicates higher correction
- Morningstar
- FinViz Stock Screener
- Earnings Whispers
- Earnings Calendar
- The Graham Investor
- WallStreetCheatSheet
- Dividend Info - Ex-dividend list - Historical Dividend Info
Stock Analysis Tools
- MSN 10 year financial summary
- ADVfn financial summary
- YChart Overlay price and valuation metrics on one chart
- GuruFocus Valuation Metrics (also 10 year financials)*****
- WikiWealth Tools:
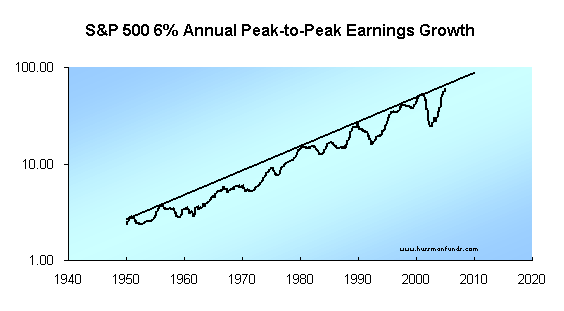
S&P Earnings
Google Ads
---- Advertisement ---- <!--
google_ad_client = "ca-pub-6606060213303530";
/* MB_LeftAd_v3 */
google_ad_slot = "9229582339";
google_ad_width = 160;
google_ad_height = 600;
//-->
Economic Analysis
- Economic indicators from Ycharts
S&P500 vs. S&P500 EBITDAper Share

Source: Zerohedge.com


